Bitcoin’s resurgence to over $47,000 has spurred the entire altcoin market, with VET among the biggest winners
The Vechain price has risen more than 28% over the past 24 hours, with bulls likely to reach a daily close above $0.12 for the first time since September 16.
The price of the VET token is currently clinging to the line near the above price target, after buyers broke through the psychological barrier at $ 0,10. As the broad market tries to extend the gains posted on Friday, the VET price could move towards another hurdle of $0.14 or higher.
Vechain’s uptrend comes as the overall market will head into October with a bullish message. Most cryptocurrencies are in the green after a troubled September interrupted by the battle of Bitcoin (BTC) and Ethereum (ETH) amid bearish news from across the market.
At the time of writing this article, BTC and ETH prices posted double-digit gains against the US dollar, breaking the $47,000 and $3,300 mark, respectively.
Price development VET/USD
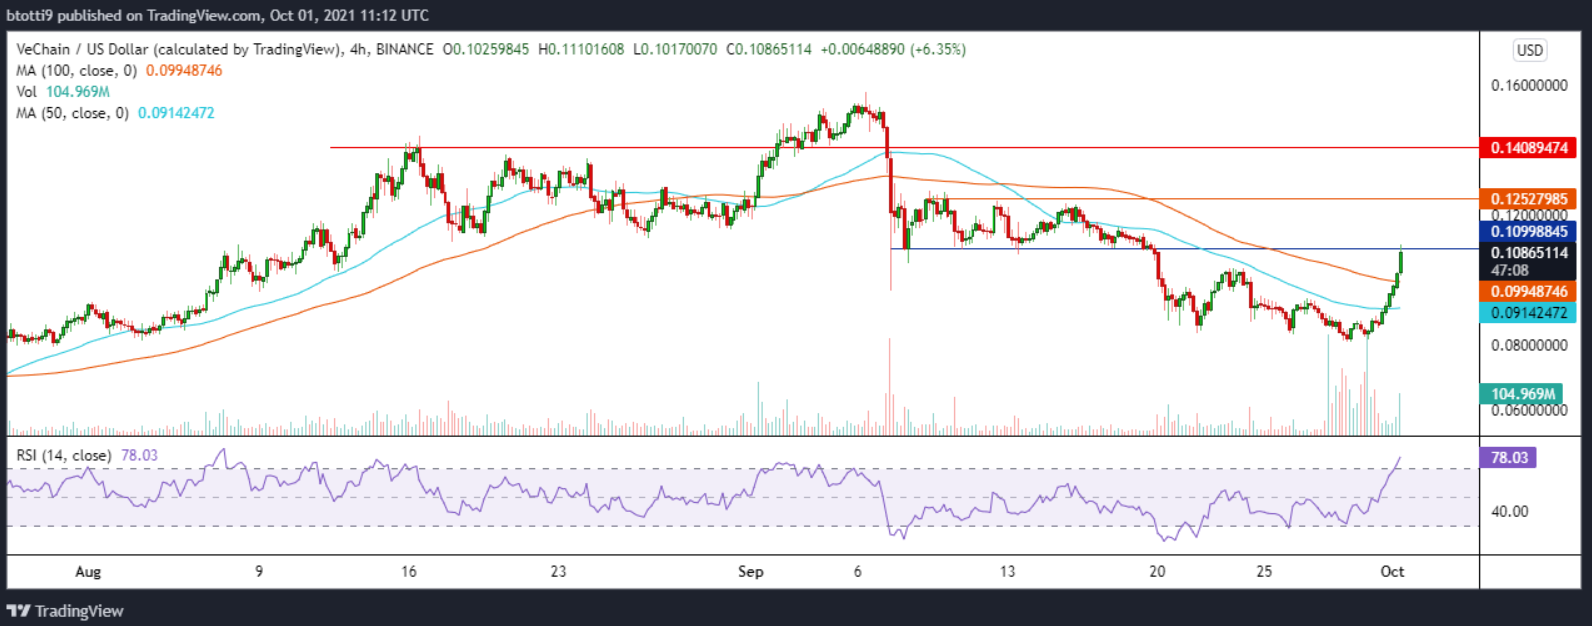
The 4-hour chart shows that Vechain is trading with a strong bullish perspective as buyers look to break out upwards. The VET/USD pair has climbed above both the 50 and 100 SMA, while the RSI is positive and remains in overbought territory.
VET/USD 4-HOUR chart. Source: TradingView
The increase in trading volume on the buyer side is likely to support the bulls in their efforts to ward off profit taking, as the current candle shows. The bulls need to rise above the blue horizontal line (at $0,11) to open the way to $0,12.
If you close above this level at the next candle, buyers will undoubtedly move towards the $ 0,14 mark (red line, which is the feature of the main resistance zone of August).
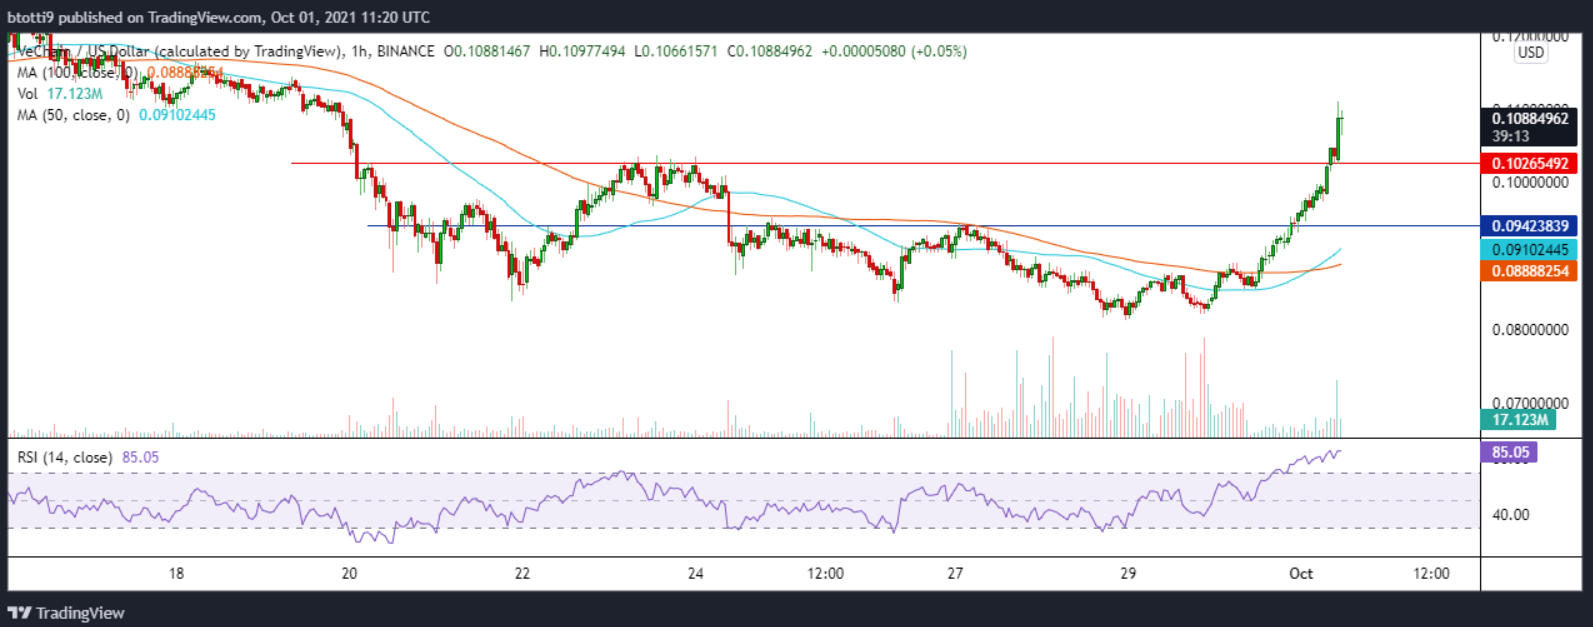
VET/USD-HOURLY chart. Source: TradingView
On the hourly chart, the VET price tries to reach support at $ 0.11. However, the RSI suggests that sellers are interested in the action and may toying with a retest of the first anchor at $0.10.
A rebound from here is likely, but if bearish appetite takes over, VET/USD could re-enter the demand zone around the 50 and 100 SMA on the hourly chart at $0.091 and $0.089, respectively.
